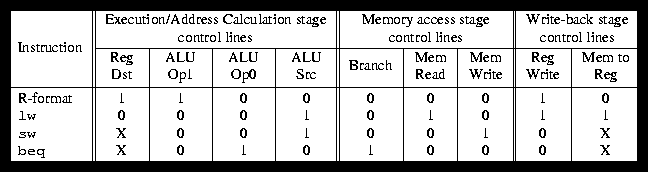
Figure 6.28: The values of the control lines are the same as in Figure 5.20 on page 361, but they have been shuffled into three groups corresponding to the last three pipeline stages.
Chapter 6: Enhancing Performance with Pipelining
- 36 of 88